Simulator Guide
Goal: Test your workspace with simulated data before connecting real devices.
What is the Simulator?
The OpenIndustrial simulator:
| Feature | Description |
|---|---|
| Custom data | Configure any telemetry structure you need |
| Three tabs | Settings, Variables, and Template for full control |
| Customizable | Adjust data ranges, frequencies, device IDs |
| Instant | Data flows immediately after deployment |
Use simulators for testing queries before connecting production devices. Same data shape, zero risk.
Prerequisites
- Active workspace
- At least one data connection created
Option A: Using the UI
Step 1: Add Simulator to Canvas
- Locate the Simulator in the Node Bank (flask icon, top of the left panel)
- Drag the Simulator onto the canvas
Step 2: Configure Settings
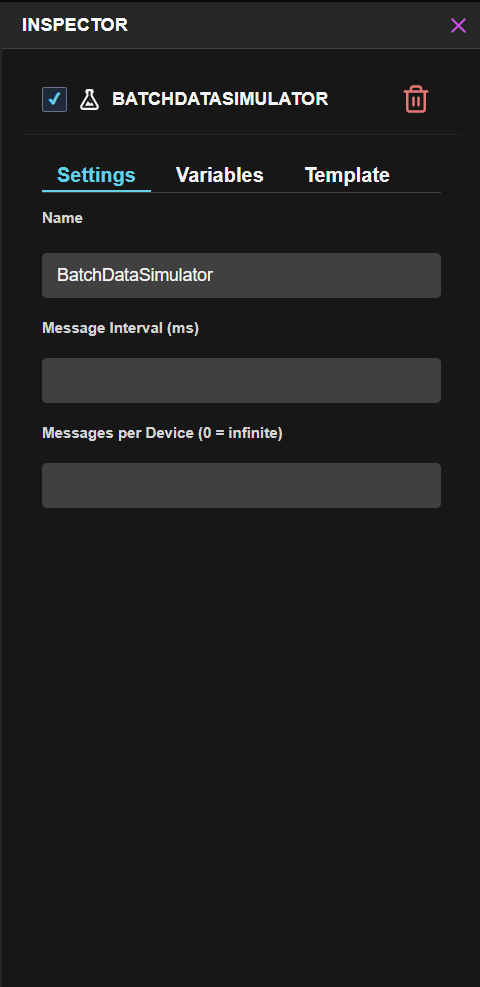
Click the Simulator node to open the Inspector. In the Settings tab:
| Setting | Description | Example |
|---|---|---|
| Name | Simulator identifier | "BreweryTelemetry" |
| Message Interval (ms) | Milliseconds between messages | 5000 (5 seconds) |
| Messages per Device | Total messages to send (0 = infinite) | 0 |
Step 3: Define Variables
In the Variables tab, click Add Variable to create data points for things you want to simulate:
| Variable Name | Type | Configuration |
|---|---|---|
| temperature | Random Integer | Min: 65, Max: 75 |
| humidity | Random Integer | Min: 40, Max: 60 |
| pressure | Random Float | Min: 14.5, Max: 15.5 |
Available variable types:
| Type | Description |
|---|---|
| Static | Fixed value that never changes |
| Random Integer | Random whole number between min/max |
| Random Float | Random decimal between min/max |
| Incrementing | Increases by 1 each message |
You only need to create variables for data you want to simulate. The deviceId (from your connection) and timestamp are automatically included.
Step 4: Define Message Template
In the Template tab, use the UI to map your variables to the message structure. Define field names and assign your variables to each field.
The Template UI lets you visually build your message structure without writing JSON directly.
Step 5: Connect to Data Connection
- Draw a line from the Simulator to your data connection node
- The edge will show "simulates" label
- Commit and deploy to start data flow
Option B: Ask Azi
Example prompts:
- "Create a simulator for my connection with temperature and humidity"
- "Add a simulator to brew-data that sends pressure readings every 5 seconds"
- "Set up simulated telemetry for test-sensors"
Verifying Data Flow
After attaching the simulator:
- Click your data connection node
- Open the Inspector panel (right side)
- You should see impulses arriving:
{
  "timestamp": "2026-01-18T10:30:00Z",
  "deviceId": "sim-temp-01",
  "temperature": 72.5,
  "humidity": 45.2
}
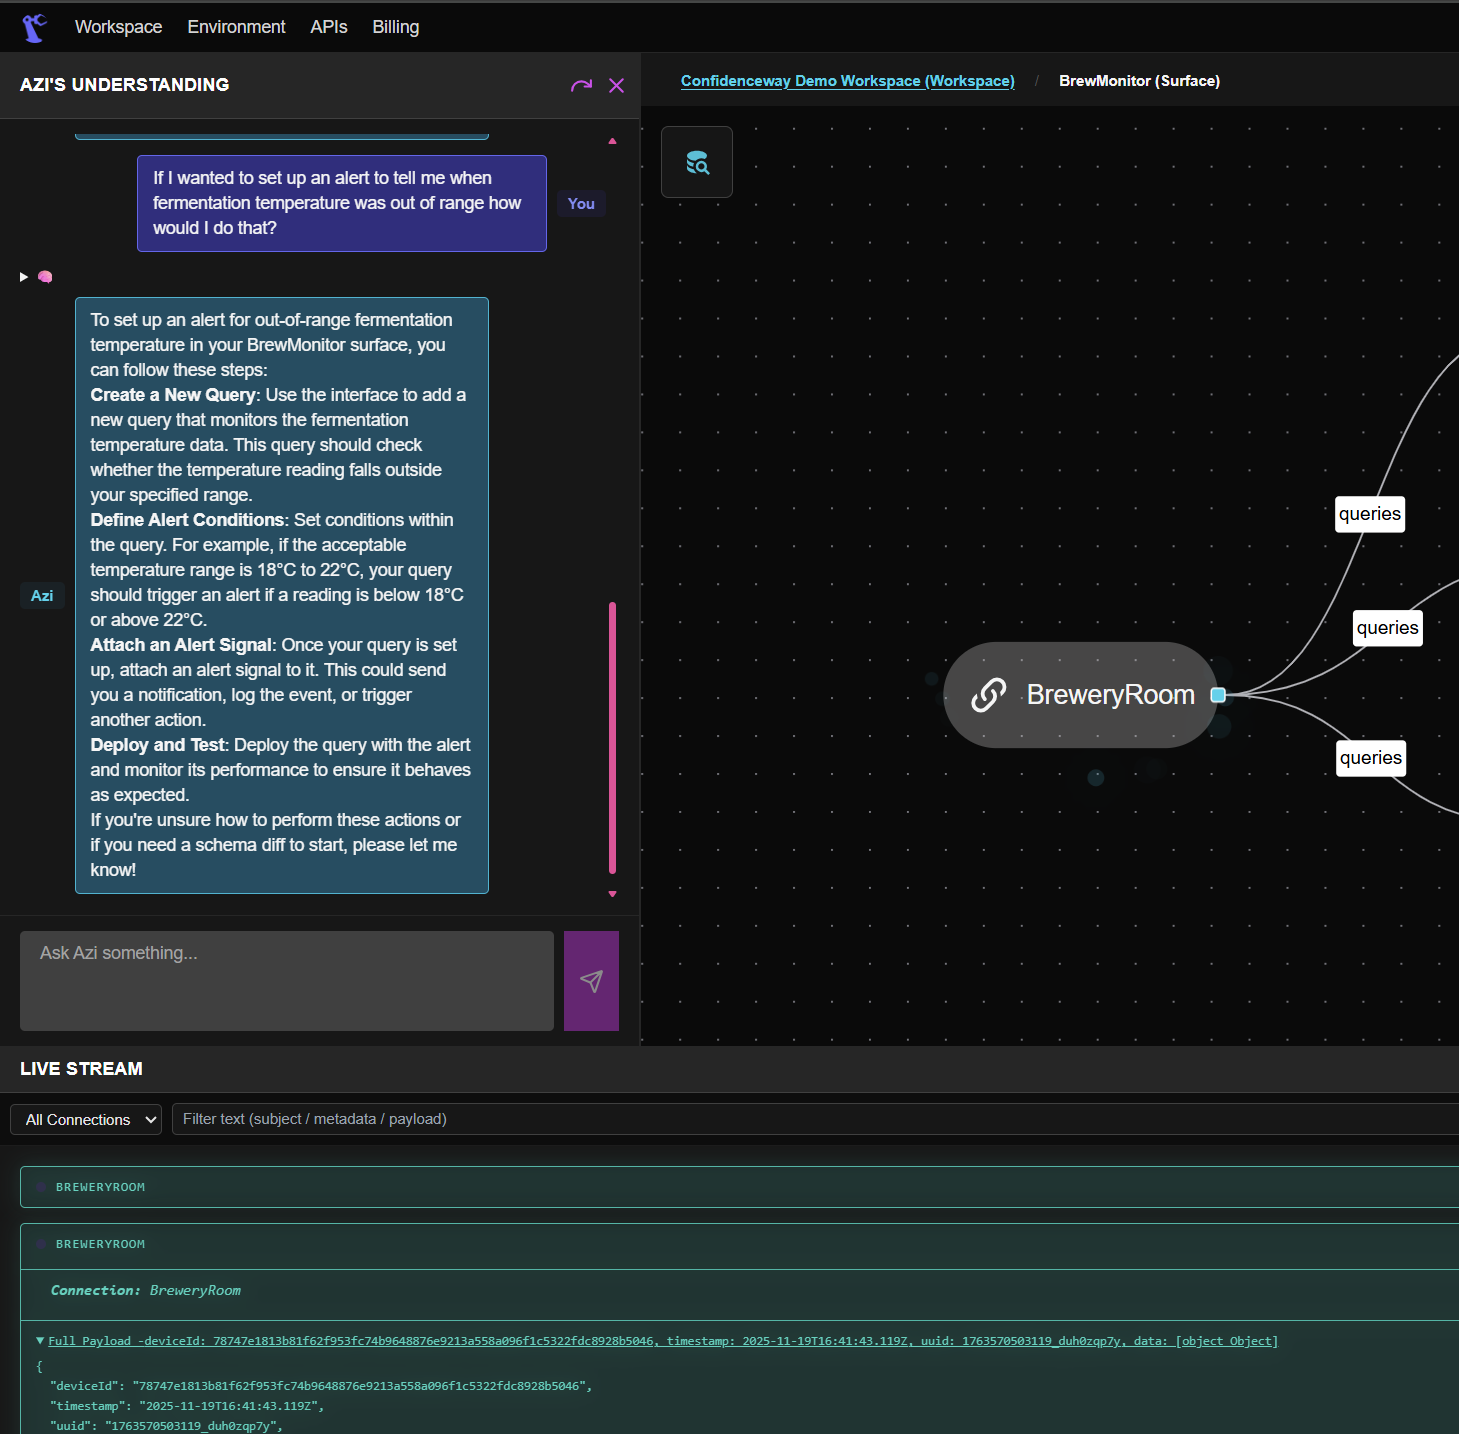
Data should appear within 5-10 seconds. If not, check that the simulator is attached to the correct connection.
Customizing Simulator Output
You can adjust simulator behavior:
| Setting | What It Controls |
|---|---|
| Frequency | How often data is generated (default: 5 seconds) |
| Device count | Number of simulated devices |
| Value ranges | Min/max for numeric fields |
| Noise | Randomness in generated values |
To Customize:
- Click the simulator node
- Open Inspector
- Adjust settings in the configuration panel
- Changes apply immediately
Troubleshooting
| Issue | Solution |
|---|---|
| No data appearing | Check simulator is attached (line should connect to data connection) and deployed |
| Data stopped | Simulator may have been paused - check status in Inspector |
| Wrong data format | Update your Variables and Template tabs to match expected structure |
| Too much data | Increase the Message Interval (ms) in Settings tab |
Simulators run continuously while attached. Detach them when not testing to avoid unnecessary data accumulation.
Best Practices
- Test queries first - Build warm queries against simulated data before production
- Match data shapes - Configure simulators to match your real device schemas
- Clean up - Detach simulators after testing to keep workspace tidy
- Document settings - Note variable names and template structure for team members
Custom Code Simulators
For more complex simulation scenarios, you can write your own simulator in any language that supports the Azure IoT Hub SDK:
| Language | Package |
|---|---|
| TypeScript/JavaScript | @azure/iot-device |
| Python | azure-iot-device |
| C# | Microsoft.Azure.Devices.Client |
| Java | com.microsoft.azure.sdk.iot |
Custom simulators connect the same way as real devices - using the device connection string from your Connection node.
Custom simulators are useful for: replay of historical data, complex state machines, integration testing, and simulating failure scenarios.
Getting the Connection String
- Click your Connection node to open the Inspector
- Find the Device Connection String in the connection details
- Use this string in your custom simulator code
Example: TypeScript Simulator
import { Client } from 'azure-iot-device';
import { Mqtt } from 'azure-iot-device-mqtt';

const connectionString = 'YOUR_DEVICE_CONNECTION_STRING';
const client = Client.fromConnectionString(connectionString, Mqtt);

async function sendTelemetry() {
  const message = {
    deviceId: 'custom-sensor-001',
    temperature: Math.random() * 10 + 65,
    humidity: Math.random() * 20 + 40,
    timestamp: new Date().toISOString()
  };

  await client.sendEvent(JSON.stringify(message));
  console.log('Sent:', message);
}

// Send every 5 seconds
setInterval(sendTelemetry, 5000);
Next Steps
| If you want to... | Go to... |
|---|---|
| Connect real devices | IoT Hub Guide → |
| Route data to surfaces | Surfaces Guide → |
| Build queries on this data | Warm Queries Guide → |
Simulators are your sandbox. Test everything here before production deployment.
On this page
- FrontmatterVersion: 1 DocumentType: Guide Title: "Simulator" Summary: "Generate realistic telemetry without hardware. Configure settings, variables, and a message template, then verify data reaches your connection." Created: 2026-01-18
- Simulator Guide