Step 2: Get Data Flowing
Goal: Attach a data source to your connection and verify telemetry is streaming.
What is a Simulator?
Simulators generate realistic telemetry data without requiring physical devices:
- Built-in simulator - Configure custom variables and message templates
- Real device - Your actual OT equipment (covered in advanced guides)
For this quickstart, we'll configure a simple simulator with temperature and humidity data.
Option A: Drag and Drop
- Locate the Simulator in the Node Bank (flask icon, top of the left panel)
- Drag the Simulator onto the canvas
- Click the Simulator node to open the Inspector
- Configure the simulator (see "Configuring the Simulator" below)
- Connect it to your "BreweryRoom" connection node by drawing a line between them
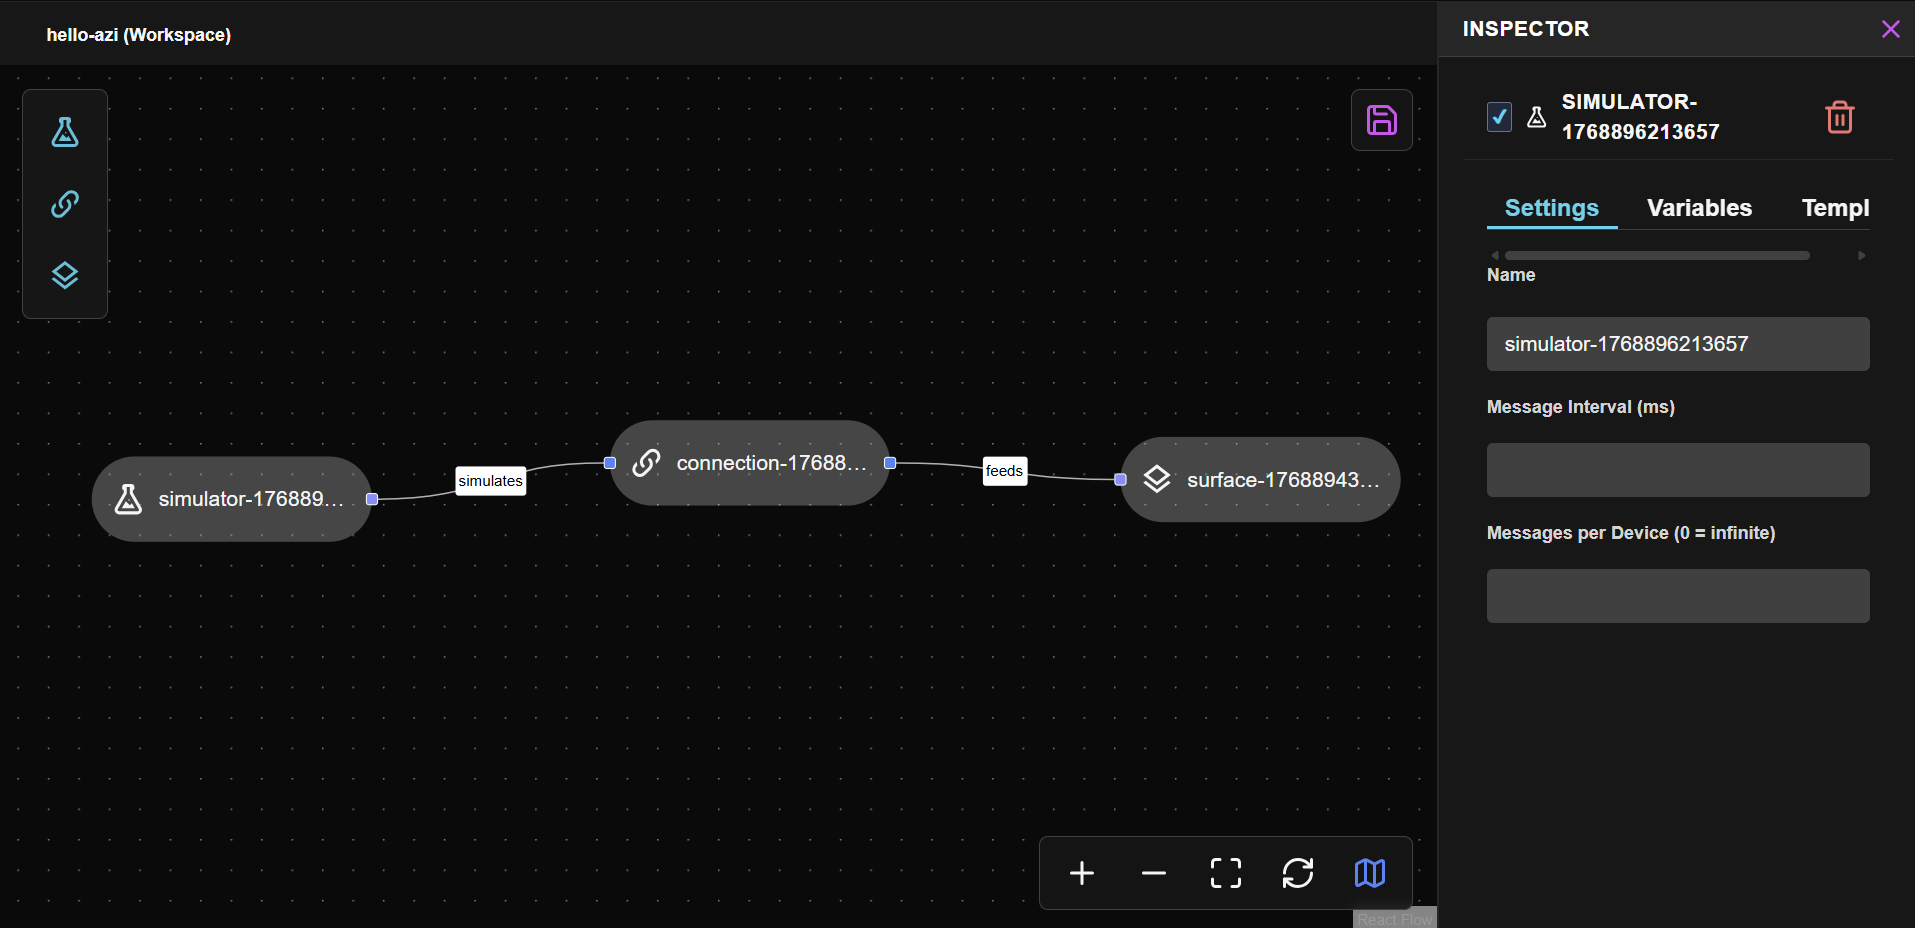
Draw a line from the simulator output to the connection input. You'll see cyan data flow particles when the connection is active.
Configuring the Simulator
The simulator has three configuration tabs in the Inspector:
Settings Tab
| Setting | Description | Example Value |
|---|---|---|
| Name | Simulator identifier | "BreweryTelemetry" |
| Message Interval (ms) | Time between messages | 5000 (5 seconds) |
| Messages per Device | Total messages (0 = infinite) | 0 |
Variables Tab
Click Add Variable to define your data points:
| Variable Name | Type | Configuration |
|---|---|---|
| temperature | Random Integer | Min: 65, Max: 75 |
| humidity | Random Integer | Min: 40, Max: 60 |
Template Tab
Use the Template UI to map your variables to the message structure. The UI lets you define field names and assign variables to each field.
The deviceId and timestamp are automatically included - you only need to map your custom variables like temperature and humidity.
Option B: Ask Azi
This is a great opportunity to see multi-turn conversations with Azi:
- Open the Azi chat panel
- Type: "Create a simulator for my BreweryRoom connection with temperature and humidity"
- Refine your request: "Limit the temperature between 65 and 75 and the humidity between 40 and 60"
- Review Azi's proposal
- Click the checkmark (✓) to approve
Need more complex simulation? You can write custom simulators in any language using the Azure IoT Hub SDK. See the Simulator Guide for details.
Save and Deploy
Now let's deploy so data starts flowing:
- Click the Save icon (upper-left, floppy disk) - it glows purple when there are uncommitted changes
- Click Deploy when the button becomes active (green checkmark appears)

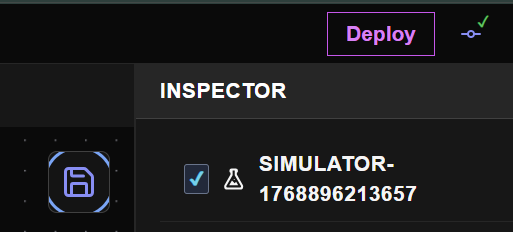
Why deploy now? The connection takes a moment to establish. By deploying here, data starts flowing while you continue learning. When you build your first query in Step 4, you'll have live data to work with.
Verify
Data is flowing when:
- Connection node shows cyan data flow particles around it
- LIVE STREAM panel (bottom of screen) shows incoming events
- Each event (called an "impulse") displays with a cyan border, connection ID, and timestamp
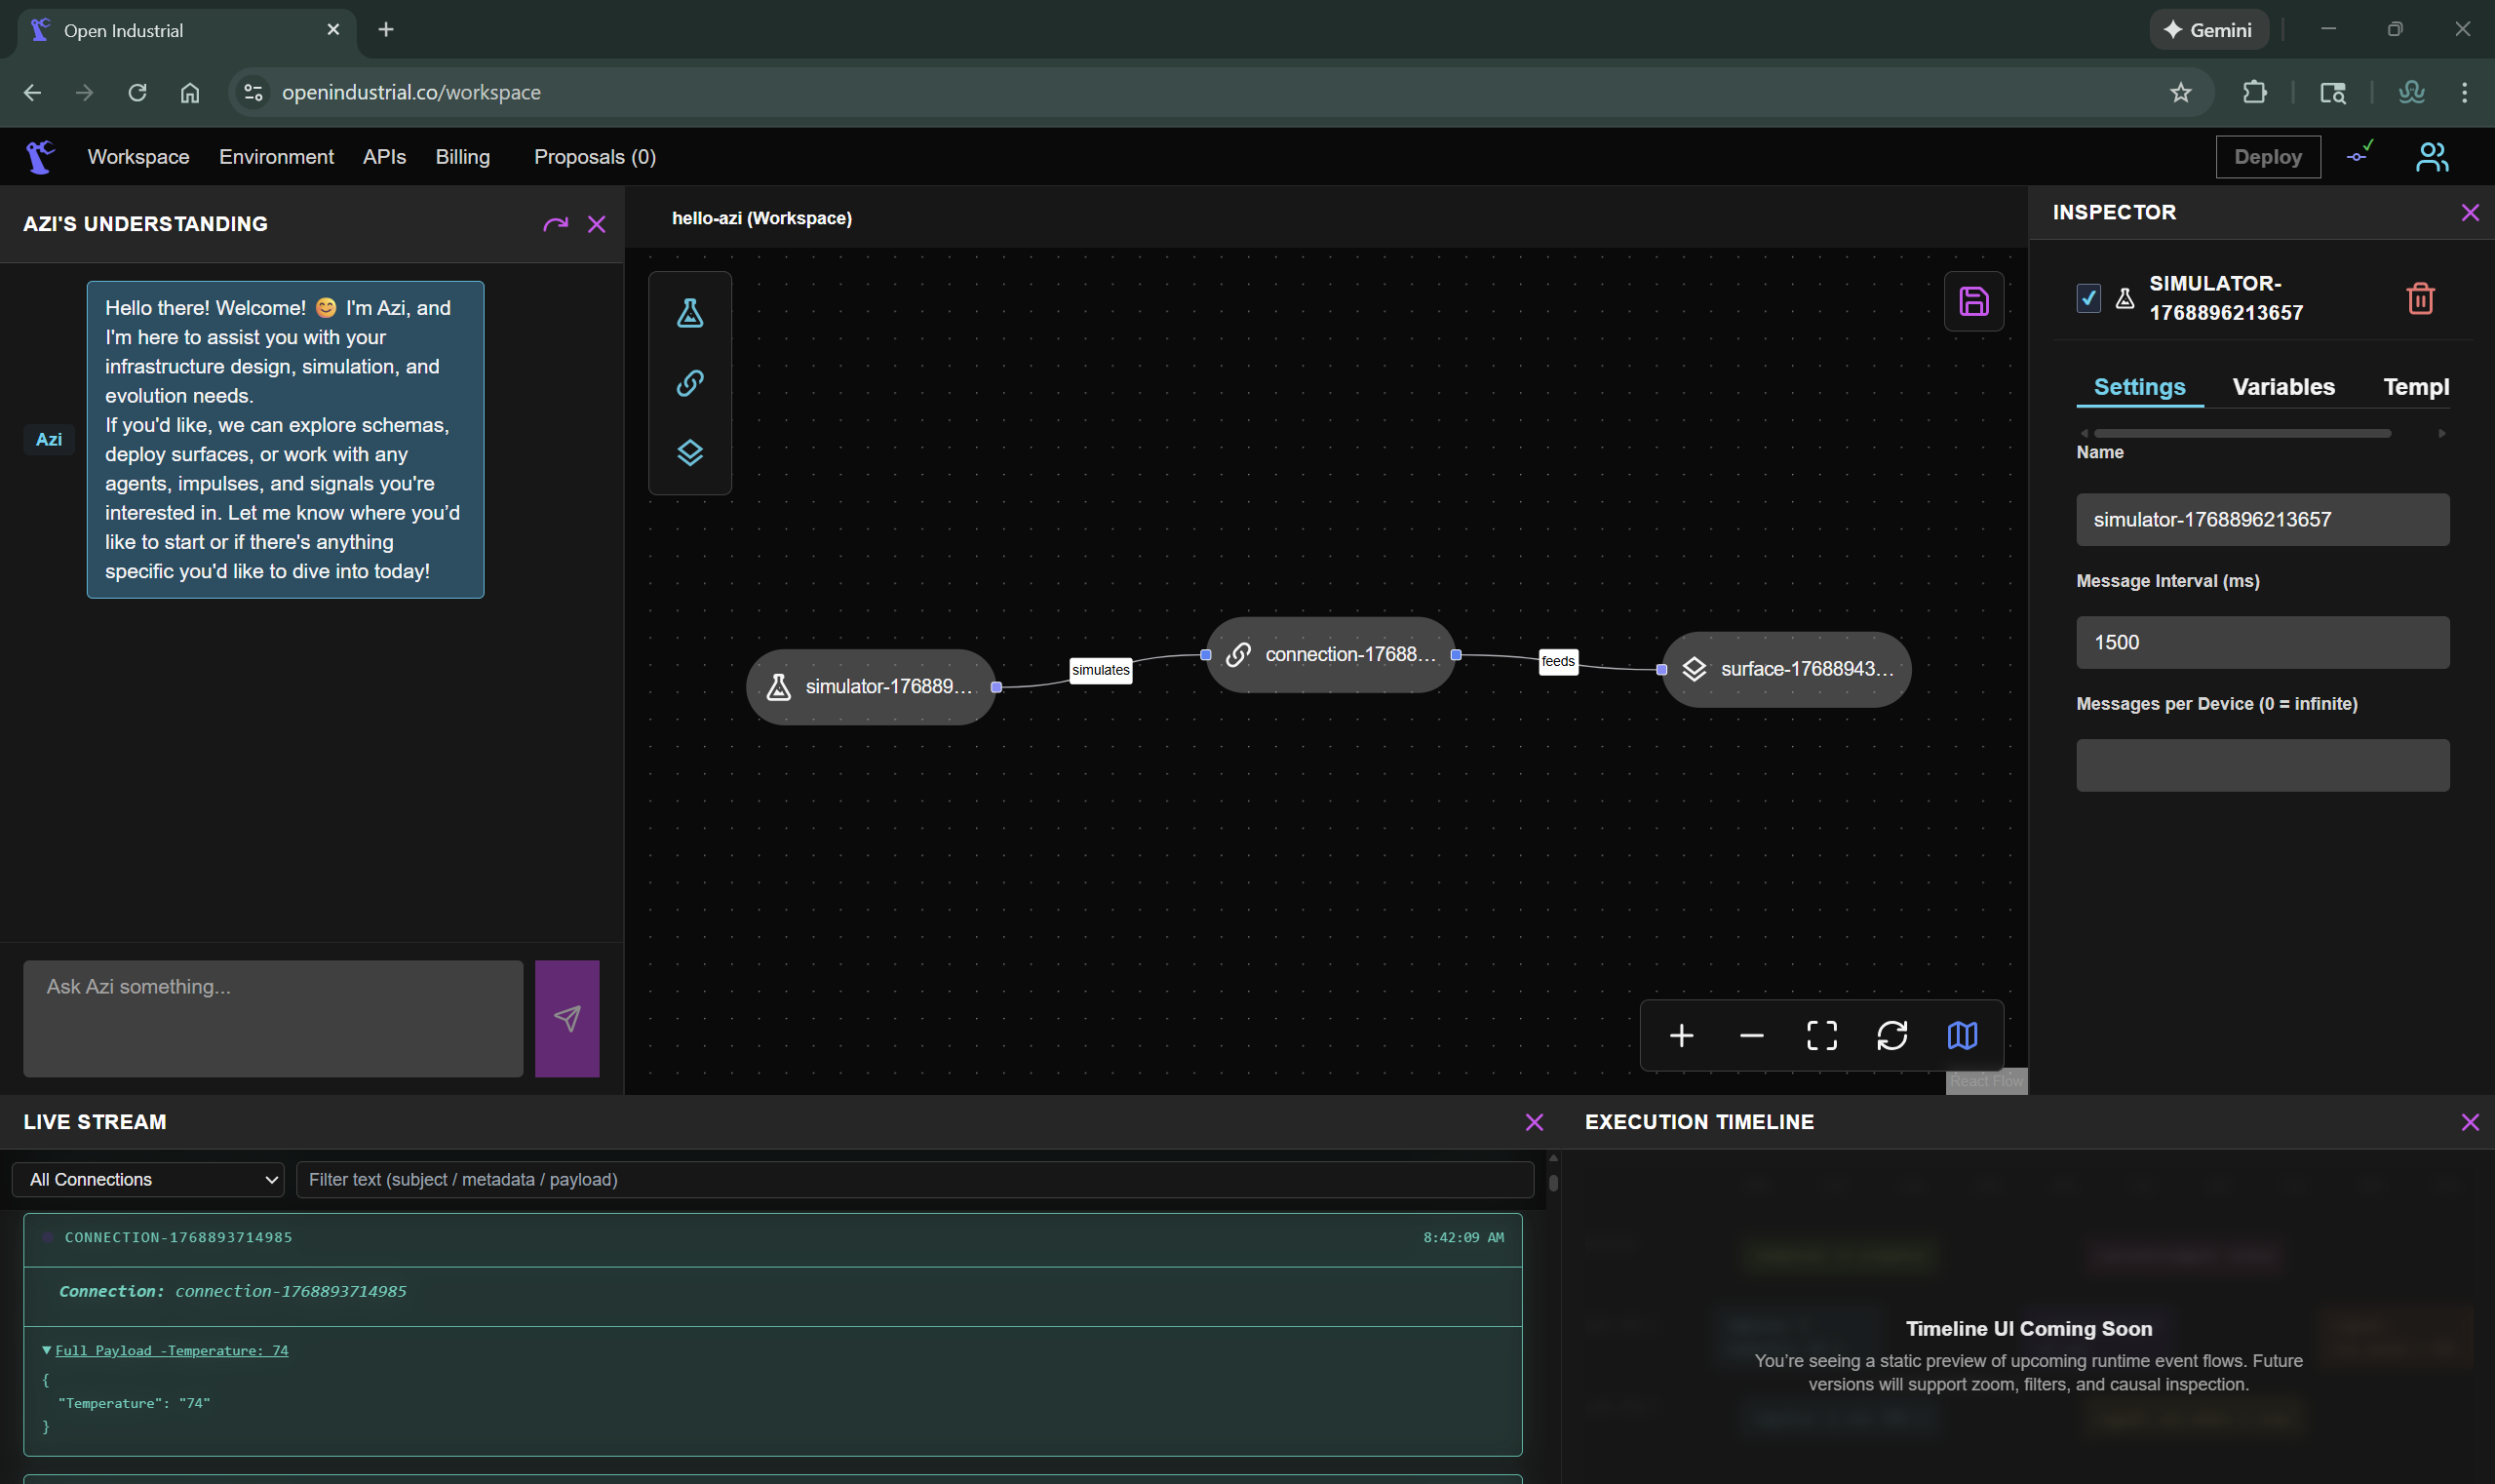
Watch the LIVE STREAM panel at the bottom - you'll see impulses arriving once the deployment completes!
You now have live telemetry flowing into your workspace. This same data will be queryable by any MCP-native AI - that's the "Bring Any AI" promise in action.
Understanding the Data
The simulator sends structured JSON combining your variables with automatic fields:
{
  "deviceId": "BreweryRoom",
  "temperature": 68,
  "humidity": 45,
  "timestamp": "2026-01-18T10:30:00Z"
}
deviceId- Automatically set from your connection nametimestamp- Automatically generatedtemperature,humidity- Your simulated variables
This data is now in your workspace - but it's not yet routed to an execution boundary. That's what surfaces are for.
What's Next
Data is flowing, but it's just passing through. In the next step, we'll connect it to a Surface - the execution boundary where queries run.